Personal Finance
How Does White Plains Stack Up for Air Fares, On-Time Flights?
Find out if your airport is a soaring success — or if that's hardly the case.

UGH! That's bound to be your instant reaction when you see the word "airport," especially if you're a person who has endured today's long lines, pat-downs, baggage fees, surly workers, crowded gate areas, dirty restrooms, weak WiFi, flights delayed, flights cancelled, garbled announcements, bad food at high prices, and annoying monitors booming cable news.
Not to mention confusing fares, packed planes, cramped cabins, smelly seatmates, testy flight attendants, disgusting seat-back trays, bumpy flights, late landings, dragged-out deplaning, missed connections, baggage delays, lost luggage, and aggravatingly long bus rides to your parked car.
Ugh, indeed.
Find out what's happening in White Plainsfor free with the latest updates from Patch.
Think you’ve had it worse than most air travelers? Find out how your local airport stacks up against others across the U.S. when it comes to ticket prices, on-time arrivals and departures, and more.
Average Air Fares from White Plains, New York
A Delta airliner taking off from an airport into a clear blue sky.
According to the government’s Bureau of Transportation Statistics, people flying out of John F. Kennedy International (JFK) or LaGuardia (LGA) or Buffalo Niagara International (BUF) are paying an average round-trip fare of $379.43 and $324.81 and $302.42 respectively.
Find out what's happening in White Plainsfor free with the latest updates from Patch.
What do you think? Does that seem high to you? Or maybe lower than you've experienced? Remember, that's the average.
The average airline ticket price in the State of New York during the third quarter of 2018 was $377.00, the government says.
The national average airline ticket price during the quarter was $444.27.
In New York, you'll pay an average 16% less than the national average.
| Region | Airport | Avg. Fare |
|---|---|---|
| U.S.A. | — | $444.27 |
| New York | — | $377.00 |
| New York-JFK | John F. Kennedy International | $379.43 |
| New York-La Guardia | LaGuardia | $324.81 |
| Buffalo | Buffalo Niagara International | $302.42 |
| Albany | Albany International | $397.17 |
| Rochester | Greater Rochester International | $358.73 |
| Syracuse | Syracuse Hancock International | $395.38 |
| Islip | Long Island MacArthur | $254.74 |
| White Plains | Westchester County | $412.72 |
| Newburgh/Poughkeepsie | Stewart International | $291.82 |
| Elmira/Corning | Elmira/Corning Regional | $456.95 |
| Plattsburgh | Plattsburgh International | $166.41 |
| Niagara Falls | Niagara Falls International | $137.63 |
| Ithaca/Cortland | Ithaca Tompkins Regional | $512.78 |
| Binghamton | Greater Binghamton/Edwin A. Link Field | $551.94 |
| Ogdensburg | Ogdensburg International | $190.02 |
| Watertown | Watertown International | $473.25 |
| Saranac Lake/Lake Placid | Adirondack Regional | $444.92 |
| Massena | Massena International-Richards Field | $738.67 |
On-time performance at JFK & LGA & BUF
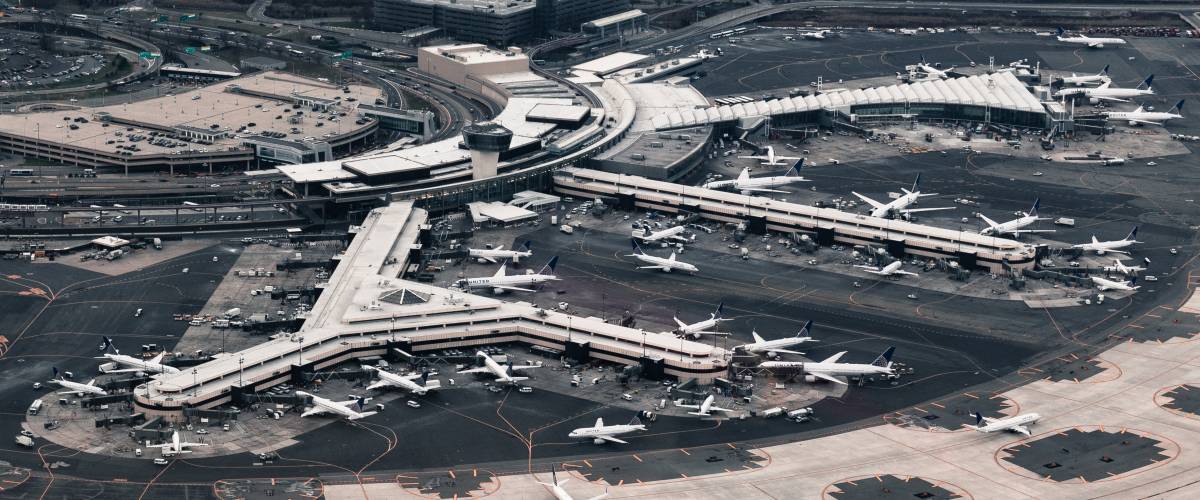
An aerial view of the airport in Newark, New Jersey.
Now let’s see how your airport rates for getting flights in and out on time. And see if your feeling that the place is ALWAYS running behind schedule is accurate.
Given your ease-of-access to multiple airports, consider booking your next flight from the airport with the best on-time performance. Of the departures from JFK and LGA and BUF last year, 78.3% and 75.7% and 80.6% respectively got off on time, and 18.8% and 19.8% and 16.5% respectively were delayed.
Now you know the odds, next time you have a flight to catch.
Where you live, do the airports have some work to do? For comparison, 82.0% of flights at all U.S. airports were on time last year through October and 16.0% were delayed, according to the federal agency.